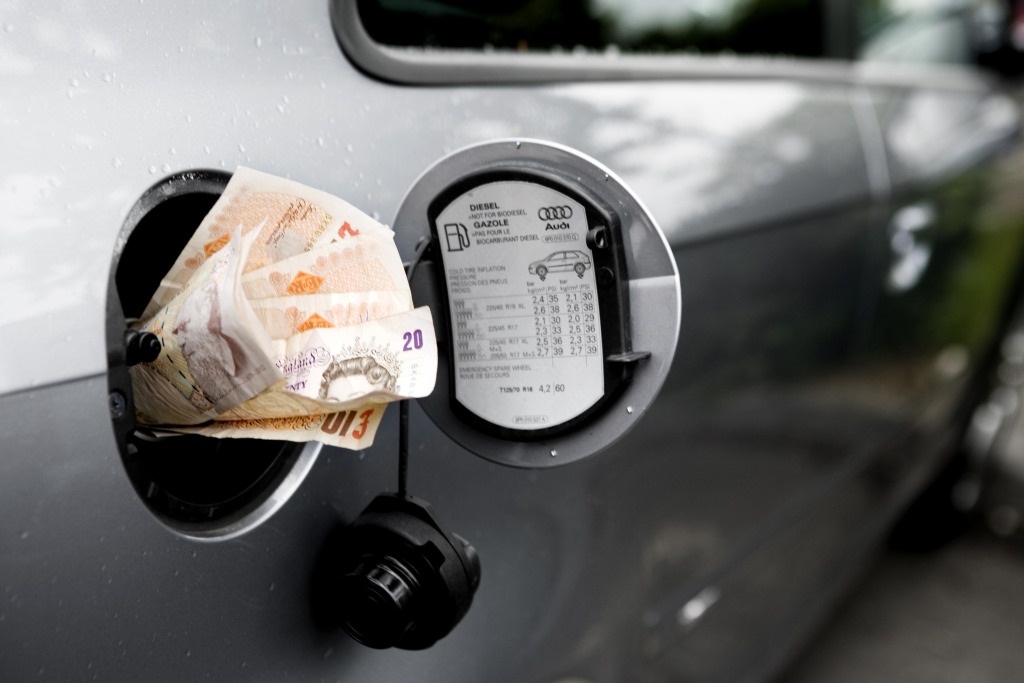
Let’s start with some bare facts. The current Government has frozen and cut fuel duty to the extent that, by the time of the next election, it will be about 20 per cent lower than what was planned at the last election. This will, apparently, save the average motorist – whoever they are – about £680 a year. Or about £11 every time they fill up their tank.
All of this is good news for motorists, right? Well, yes – on paper. But, as any fule kno, the world isn’t made out of paper. It’s made out of finite resources and unknowable patterns and billions of people. Even something as innocuous as a tax cut can upset the balance in unforeseen and unwanted ways.
Imagine that because of George Osborne’s munificence at the Despatch Box you decide to make more journeys by car. And then imagine that, for similar reasons, your neighbour decides to do the same. And then their neighbour and their neighbour and their neighbour. Hell! Let’s just say that everyone is making more journeys by car. That’s an awful lot more vehicles on the road at any one time. Your little Sunday jaunt could soon hit a traffic jam.
Of course, the effects can be also positive. The Treasury and HM Revenue & Customs demonstrated this in their report Analysis of the dynamic effects of fuel duty reductions, earlier this year. It suggested that, thanks to Mr Osborne’s cuts to fuel duty, the economy will be about 0.4 per cent bigger in 20 years’ time. Tomorrow’s motorists, as well as today’s, will have reason to be grateful for the Chancellor.
How did the Whitehall wonks arrive at that number? The answer is dynamic modelling. HMRC has at its fingertips something called a ‘Computable General Equilibrium’ model. This accounts for various factors in the economy and how they might be affected by a change in policy. And so a cut to fuel duty could stimulate more business, which could lead to more spending, which could… you get the point. The civil servants imputed the relevant numbers into their CGE model and came out with 0.4 per cent.
This dynamic modelling also has implications for the Exchequer’s accounts. With a simple model, a tax cut will probably reduce the amount of money going towards the state. But, with a more complicated model, that needn’t be the case. It all depends on how people change their behaviour in response to the policy. A higher income tax rate could just mean that people work less, thereby reducing the money going to the Exchequer. Lower fuel levies could have more people driving to the shops, thereby increasing VAT revenues. It’s the fiscal equivalent of the butterfly effect.
As it is, Mr Osborne’s assorted fuel duty cuts and freezes don’t quite pay for themselves – but they go some way in that direction. As the Government’s analysis puts it:
‘The modelling shows increased profits, wages and consumption all add to higher tax revenues. As a result, the cost of the policy falls by between 37 and 56 per cent in the long-term.’
Doesn’t it sound wonderful? A tax cut that gets cheaper for the Exchequer as time passes? Perhaps it will create enough fiscal space for tax cuts elsewhere.
But let’s not get carried away. There’s a big problem with these dynamic models: they are still a gross oversimplification of the real world. No computer programme, as yet, can hope to account for every single variable, vagary and vicissitude of life. The Treasury’s computer programme barely accounts for a fraction of them. It makes grand assumptions about the state of the economy and of economic policy in the future. It discounts various potential shocks, such as Scottish independence or alien invasion. And it doesn’t even try to say anything about congestion or emissions.
Nothing about congestion? The Government report defends itself by saying that ‘it is not expected that these impacts would have a material effect on the main findings in this report’. But when you consider all of the other simplifications that have been made – rounding out everything from monetary policy to technological developments – those main findings do look rather rickety. 0.4 per cent of GDP in twenty years’ time is a relatively small fraction and a relatively distant future. It wouldn’t take much to change it.
This is why the report emphasises that its figures aren’t forecasts – how could they be? But even if they were perfect forecasts, I’d advise you not to be too impressed by them. This is because they only concern the macro-economy and the public finances. Most normal people are concerned about more than that.
Let’s return to that traffic jam scenario I described several paragraphs ago. It is itself a simplification, but it serves to illustrate the point. For the Treasury and HMRC, the possibility of increased congestion doesn’t compute. Yet for you and me it could mean missing that concert, which is frustrating as well as costly.
This ought to prompt various questions, such as: would I prefer a penny off fuel duty, or would I prefer to get to work on time? That may not be the exact choice at hand, for we do not know the precise effects of a penny off fuel duty. But the truth is that fiscal policy does involve choices. There’s a good amount of evidence from America, for instance, that low fuel taxes correlate with shoddy roads. Do you want guns or butter? Tax cuts or infrastructure?
And so it gets more and more complicated. But this is the point: economies, let alone countries, aren’t simple things. Dynamic modelling goes some way towards recognising this, but dynamic modelling isn’t enough. The next time the Chancellor decides to reduce the rate of fuel duty, you’ll just have to make your own mind up. Welcome to democracy.


